On January 17, 2026, Harvard trailed Princeton 65–72 in Cambridge with two minutes to play. Harvard's bench had nothing left, all four timeouts already spent. No 30-second break to draw up a play, no chance to stop the clock and reset a defense, none of the "advance the ball to halfcourt" benefit teams get when they call time in the final minute. Just five guys, a running clock, and a seven-point deficit.
Harvard scored the next seven points, forced overtime, and won, 87–80.
It's the kind of finish that fuels the "timeouts don't matter, players win games" argument. It's also exactly one game. So I pulled the play-by-play record for every Division I men's game I could get my hands on: 11 seasons, 2016 through 2026, 56,188 games, and asked a more careful question: across tens of thousands of close games, does having a timeout in your pocket late actually move the needle on winning?
Short answer: yes, measurably, in a specific and fairly interesting shape. The longer answer is more useful, and includes a few things that surprised me, including one stat that looks dramatic and is almost entirely a mirage, and a piece of broadcast conventional wisdom that doesn't survive contact with the data at all.
Method, briefly (so you can trust the numbers)
- Data: ESPN play-by-play for Division I men's basketball, seasons 2016–2026, nearly 19.2 million individual logged plays across 56,188 games. Ten of the eleven seasons run through non-conference play, conference play, and conference tournaments; the 2025–26 season additionally runs through the national championship. This is overwhelmingly a regular-season-and-conference-tournament finding, not a March-specific one.
- Timeout tracking: NCAA men's rules allot each team four timeouts per regulation game (with no more than three usable in the second half) plus one more per overtime period. I reconstructed every team's live timeout bank, play by play, for all 56,188 games, attributing all 276,268 team-charged timeout events to the correct team using ESPN's own team ID on each event, cross-checked against a text-parsing fallback. Match rate: 100%, verified season by season, zero unresolved cases.
- Checkpoints: I froze the game state, score and each team's remaining timeouts, at four moments as regulation ticked under 5:00, 2:00, 1:00, and 0:30 remaining, producing 449,502 team-checkpoint snapshots.
- "Close game": within 8 points at the checkpoint, roughly the line past which a possession or two can still realistically flip the outcome late.
- The trap I avoided: raw, unconditioned correlations between "timeouts remaining" and win% are badly misleading, because trailing teams call more timeouts (to stop runs) while comfortably-leading teams often coast without needing them. Section 3 below shows exactly how badly that trap distorts the picture if you don't control for the scoreline, every other number in this piece holds the score and situation constant before comparing.
1. The comeback question
At the two-minute mark of a game within 8 points, trailing teams with at least one timeout still in the bank completed the comeback (won outright) 16.7% of the time (3,992 of 23,908). Trailing teams with nothing left won just 12.8% of the time (113 of 883). That's a statistically significant gap (p = 0.003), worth about a 30% relative bump in comeback odds just from having a timeout available.
That edge isn't flat across the clock:
| Time remaining | Win%: 0 timeouts | Win%: 1+ timeouts | Edge (points) | Edge (relative) |
|---|---|---|---|---|
| 5:00 | 19.7% | 22.9% | +3.2 | +16% |
| 2:00 | 12.8% | 16.7% | +3.9 | +31% |
| 1:00 | 9.2% | 13.3% | +4.1 | +46% |
| 0:30 | 8.5% | 11.6% | +3.1 | +37% |
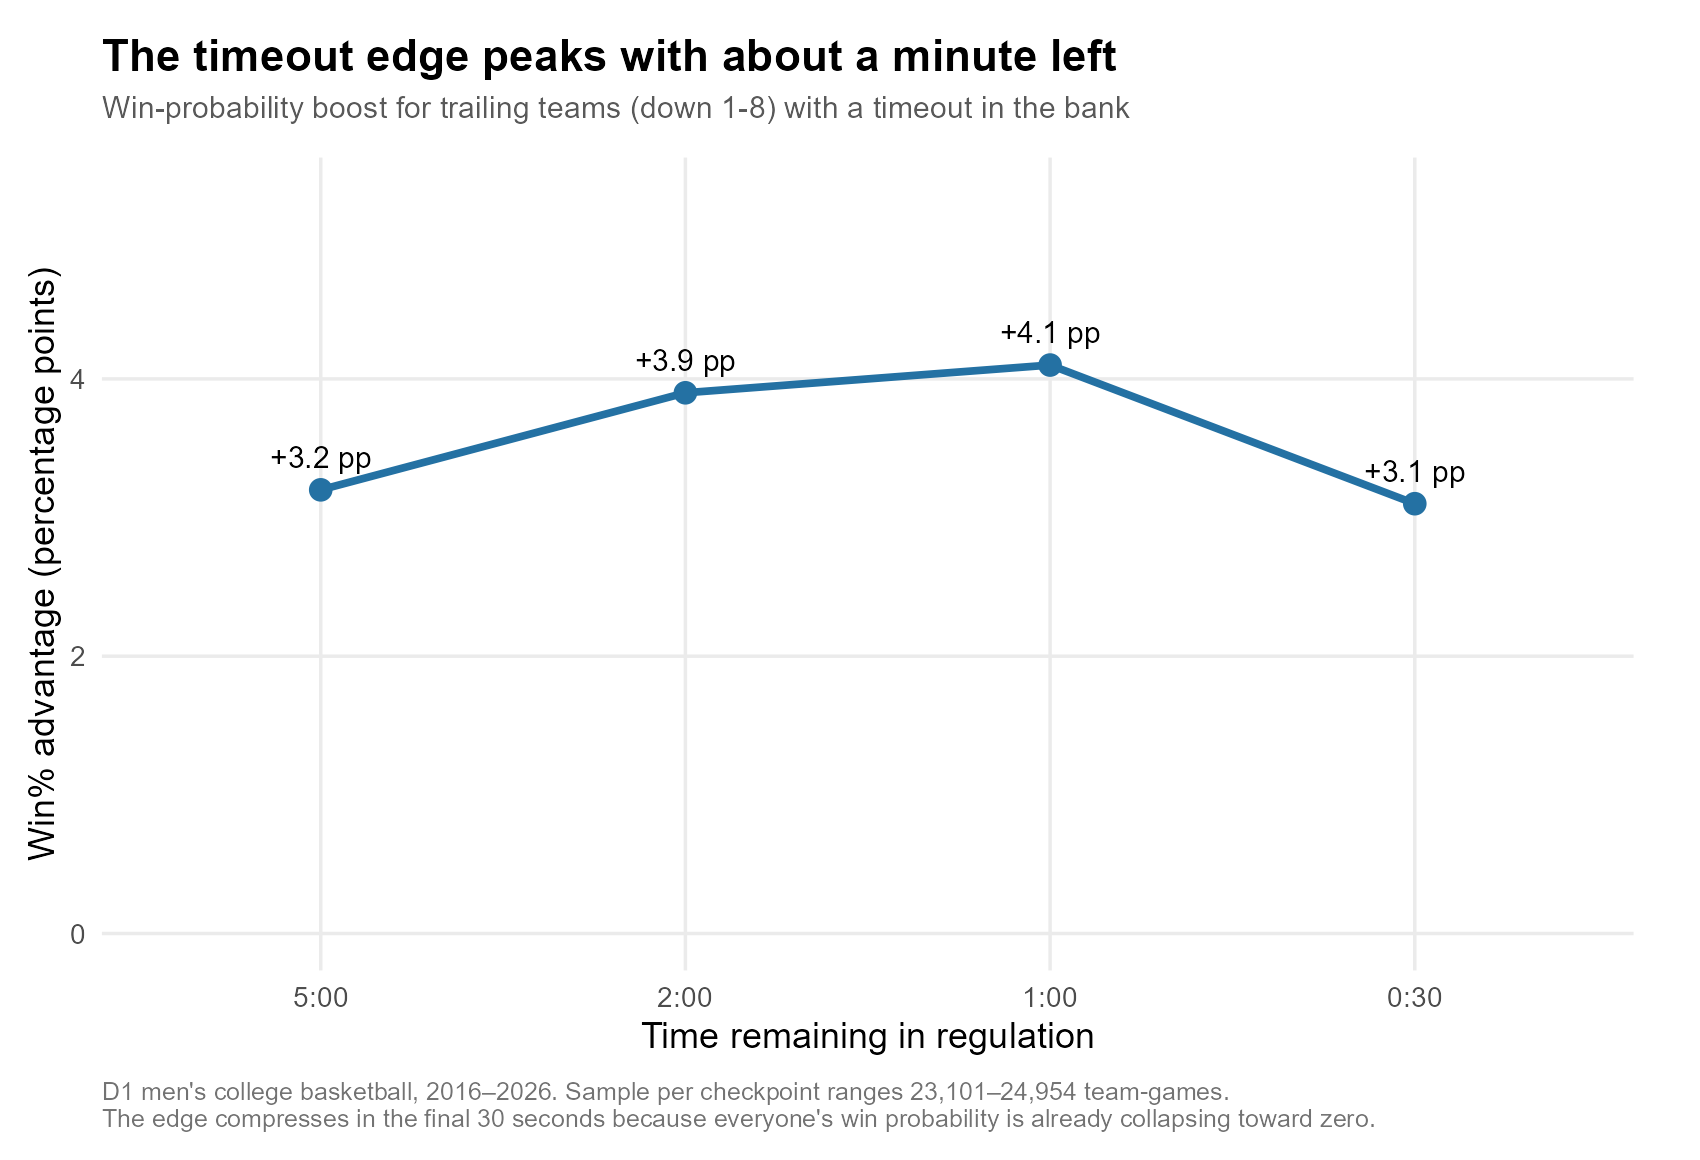
The premium climbs as the game tightens, peaks with about a minute left, then compresses slightly in the final 30 seconds, not because timeouts stop mattering, but because everyone's win probability is collapsing toward zero by then, leaving less room on the board for anything to move a raw percentage point. In relative terms, a trailing team with a timeout left and a minute to go is roughly 46% more likely to complete the comeback than an identical team with none.
Break the 2:00 checkpoint down by exact deficit and the picture gets more honest, and more interesting:
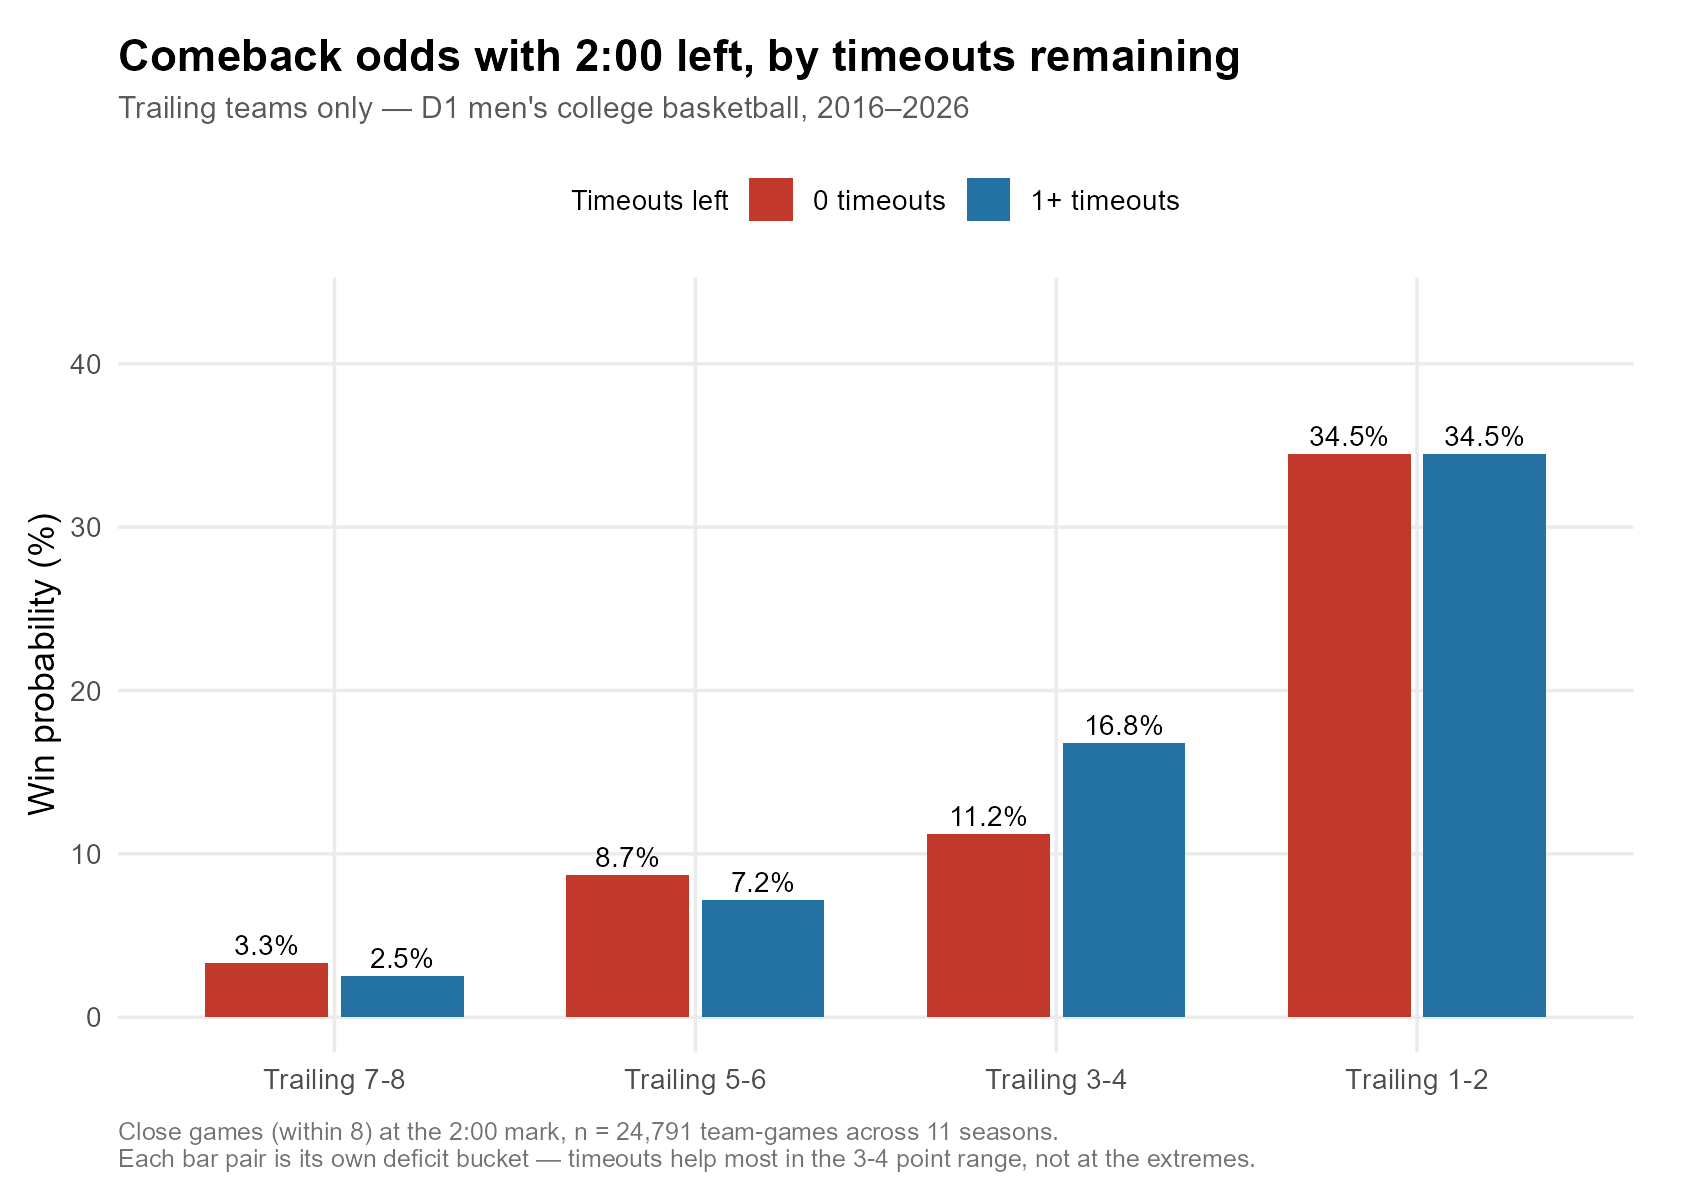
- Trailing 3–4: 16.8% (with a timeout) vs. 11.2% (without), the single largest edge, +5.6 points. This is the "you need two scores, not one" zone, where a timeout to draw up the right two possessions matters most.
- Trailing 1–2: 34.5% vs. 34.5%, dead even. Down just a possession, you may not need the timeout at all; good teams can just go get a bucket.
- Trailing 5–6 and Trailing 7–8: numerically favor the zero-timeout group, but on small samples (230 and 270 zero-timeout games, respectively), treat these as statistical noise, not a real reversal, rather than pretending a clean story extends everywhere.
The pooled, headline number (16.7% vs. 12.8%) is real. But it's carried almost entirely by the two-to-three-possession deficit range, not spread evenly across every losing situation.
One more angle on survival, not just winning outright: among trailing teams, having a timeout also raised the rate of "won in regulation, won in overtime, or at least forced overtime" from 17.8% to 22.5% (p = 0.001).
2. Protecting a lead
Flip the perspective. Leading teams at the 2:00 mark of a close game won 83.5% of the time with a timeout in the bank, versus 78.3% with none, a smaller but still real +5.2-point gap (p = 0.003).
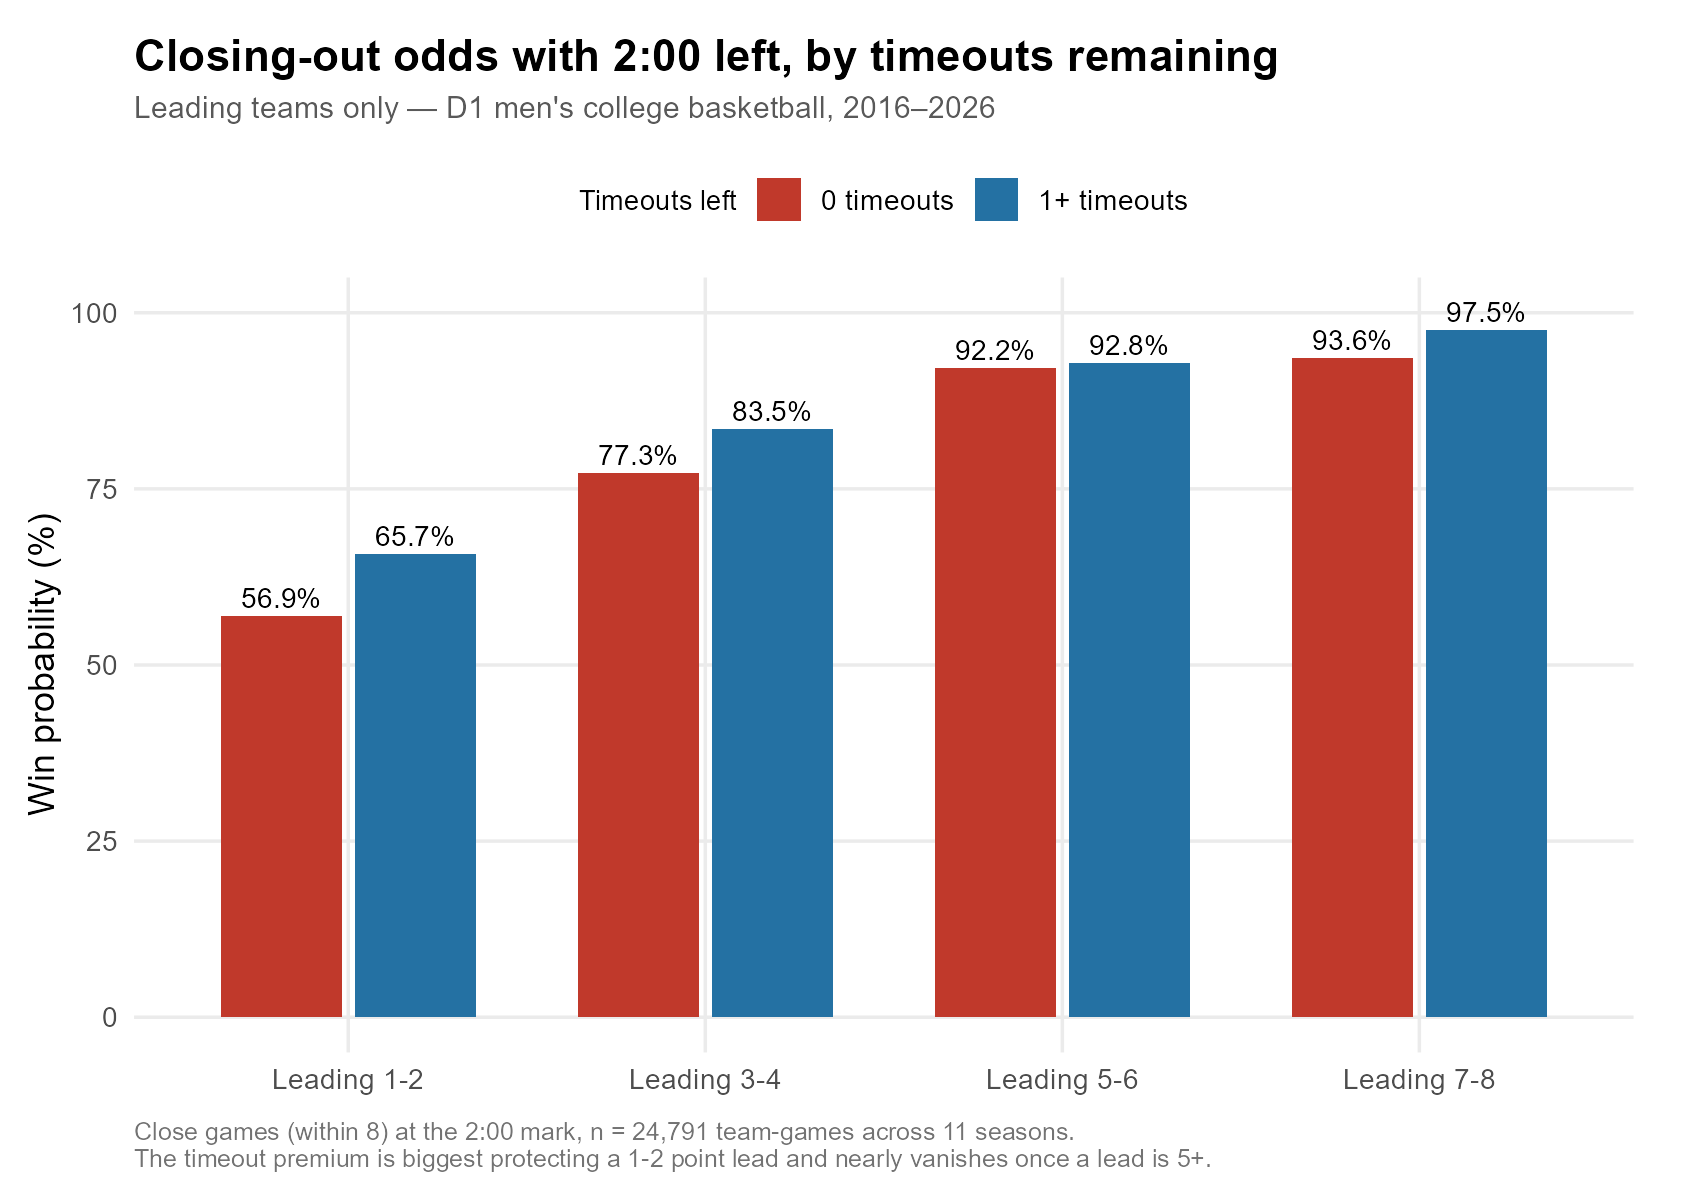
Same shape as the comeback data: the premium is largest for the smallest leads (Leading 1–2: 65.7% vs. 56.9%, a full +8.8 points) and nearly vanishes once a lead is safely into "coast" territory (Leading 5–6: 92.8% vs. 92.2%, essentially a wash).
It's not just your own timeouts, either, your opponent's matter just as much:
| You | Opponent | Win probability |
|---|---|---|
| Have timeouts | Opponent has none | 87.9% |
| Have timeouts | Opponent has timeouts | 83.4% |
| Have none | Opponent has none | 84.4% |
| Have none | Opponent has timeouts | 74.4% |
The swing between the best case (you're stocked, they're empty) and the worst case (you're empty, they're stocked) is 13.5 percentage points, the single largest gap in this whole analysis, and a good reminder that a timeout is a relative resource, not an absolute one.
3. The stat you shouldn't trust
Here's the trap I mentioned. Pull win% by raw timeout count remaining at the 2:00 mark, ignoring the score entirely, and you get this:
| Timeouts remaining at 2:00 | Win rate |
|---|---|
| 0 | 21.7% |
| 1 | 29.7% |
| 2 | 48.7% |
| 3 | 63.4% |
| 4 | 65.6% |
That's a 44-point gap between teams with zero timeouts and teams with all four, enormous, and almost entirely fake. Trailing teams call timeouts to stop bleeding, so they burn through their allotment faster; teams already comfortably ahead often coast to the finish without calling one at all. This raw number is mostly measuring "who's already losing," not "what a timeout is worth."
Compare it to the properly scoreline-controlled numbers in Sections 1–2, a 3-to-9-point gap depending on situation, not 44. That's the actual size of the effect once the confound is stripped out. If you only remember one methodological lesson from this piece, make it this one: never trust a timeout stat that hasn't been checked against the scoreline first.
4. Relative advantage
Rather than "do you have a timeout," what about "do you have more than your opponent"? Restricting to close games (within 8) at the 2:00 mark and looking at the differential:
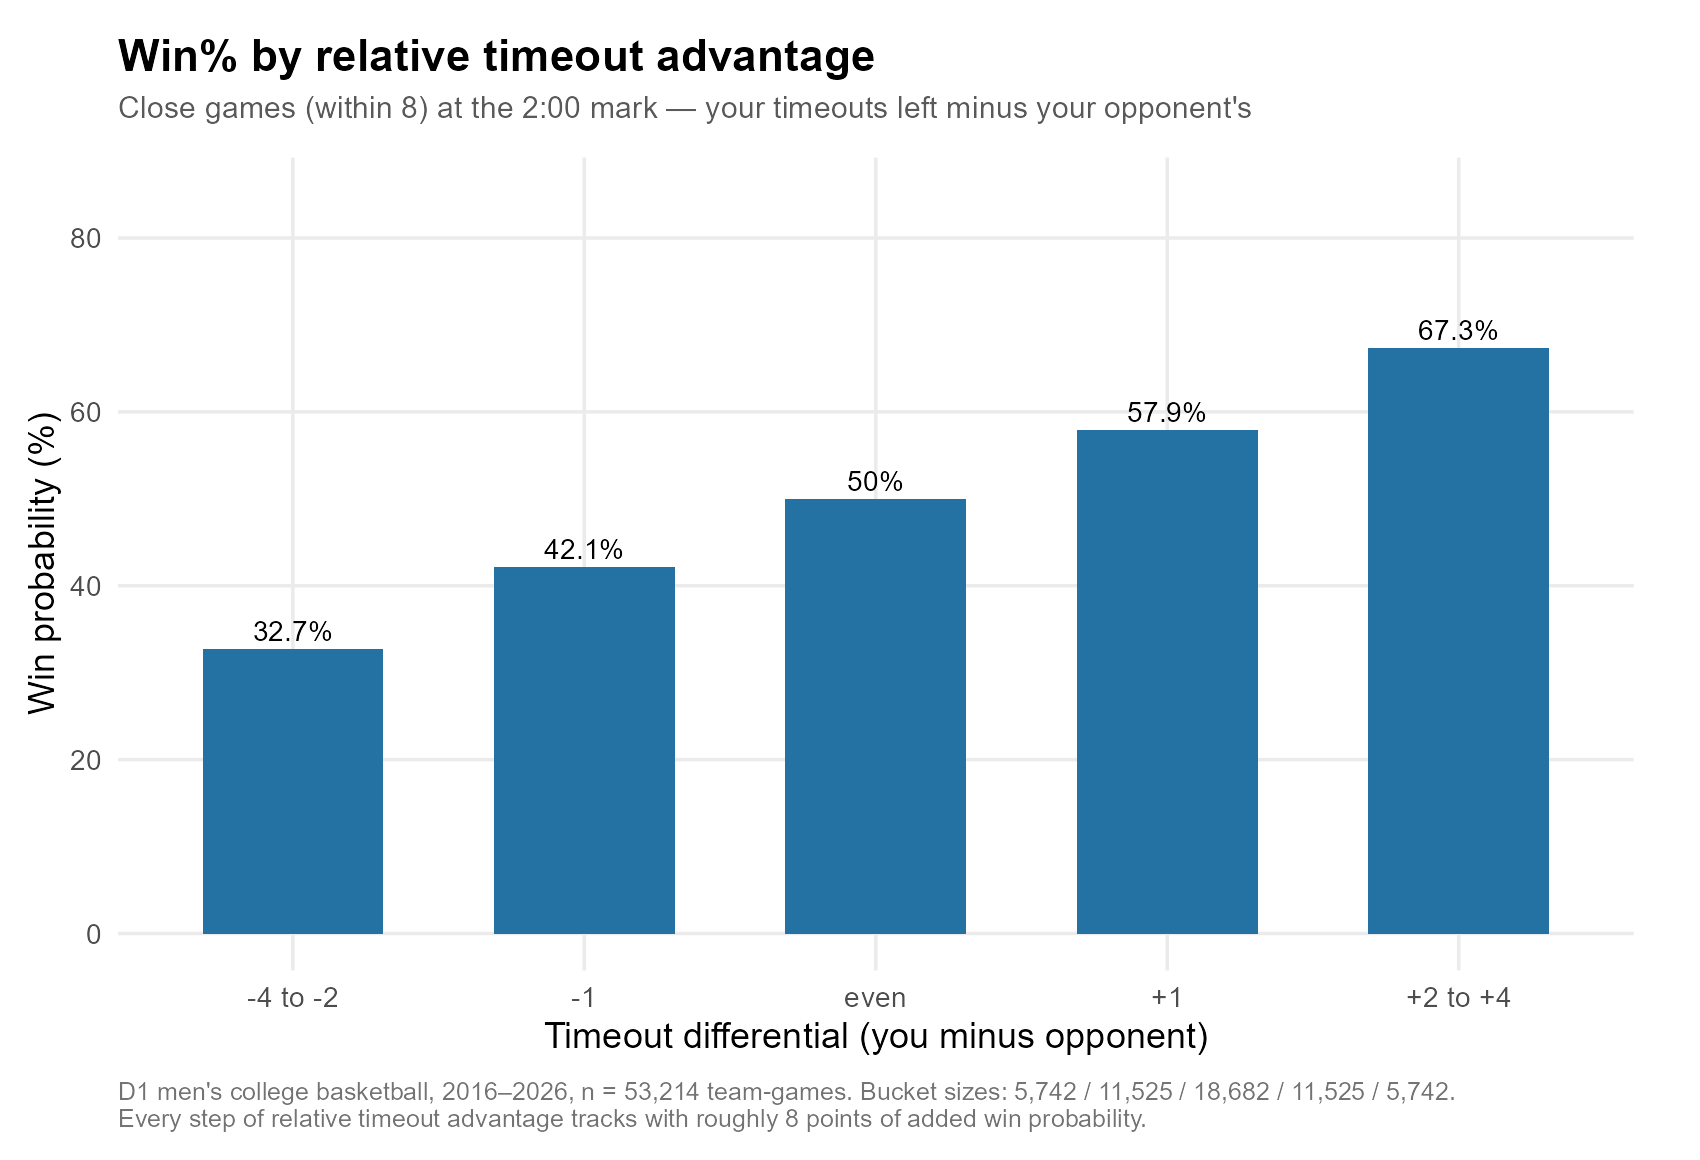
A remarkably clean staircase: from 32.7% win probability when you're down two-plus timeouts on your opponent, up to 73.8% when you're up three or four, each step worth roughly 8 points of win probability, and dead even at 50.0% when the banks match. (One honest caveat: this view doesn't hold the score constant the way Sections 1–2 do, part of it reflects that leading teams also tend to have saved more timeouts. It's a clean, consistent layer on top of the score-controlled results above, not a contradiction of them.)
5. Forcing overtime
Winning outright isn't the only outcome worth measuring, sometimes just staying alive is the achievement. Among teams tied or trailing by 3 or fewer with 1:00 left, having a timeout bumped "won in regulation, won in overtime, or at least forced overtime" from 39.3% to 43.0% (p = 0.05, right on the edge of conventional significance, so read this one as suggestive rather than proven).
Split it in two, though, and the story sharpens: the rate of specifically forcing overtime barely moved at all (22.0% vs. 22.9%, not remotely significant). A timeout doesn't obviously help a team tie the game. The lift shows up entirely in extra regulation wins, suggesting a timeout in this window helps teams finish the job outright more than it helps them merely survive to overtime.
6. A decade of behavior, is this changing?
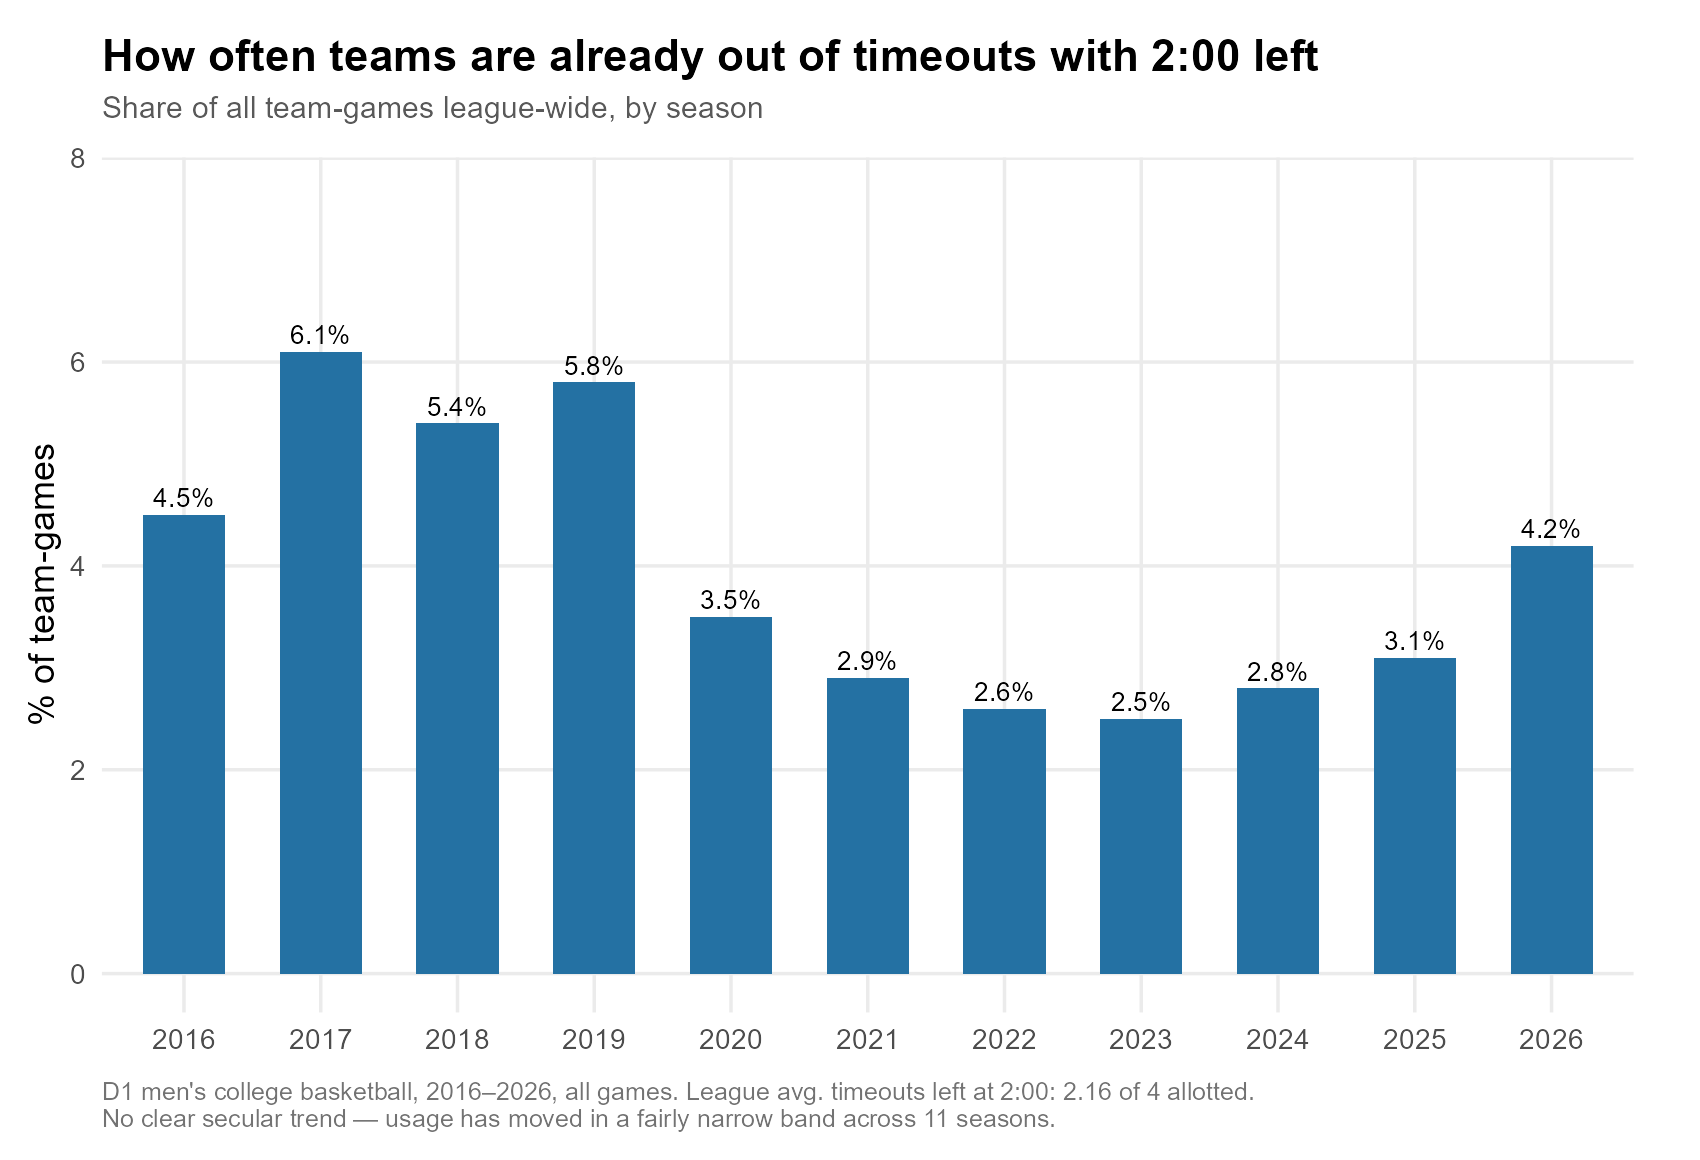
Across 11 seasons, the share of teams already tapped out with 2:00 left has bounced between roughly 2.5% and 6.1% with no clear secular trend, slightly higher early in the sample (2017–2019, 5.4–6.1%), lower through the pandemic-era seasons (2020–2023, 2.5–3.5%), and ticking back up recently (4.2% in 2025–26). League-wide, the average team still has 2.24 of its 4 timeouts in the bank at the 2:00 mark, and roughly 1 in 8 team-games (12.3%) reach that point with the full allotment completely untouched. There's no evidence coaches have systematically become more trigger-happy, or more prone to hoarding, with the whistle over the past decade.
7. Bonus: does "icing" a free-throw shooter actually work?
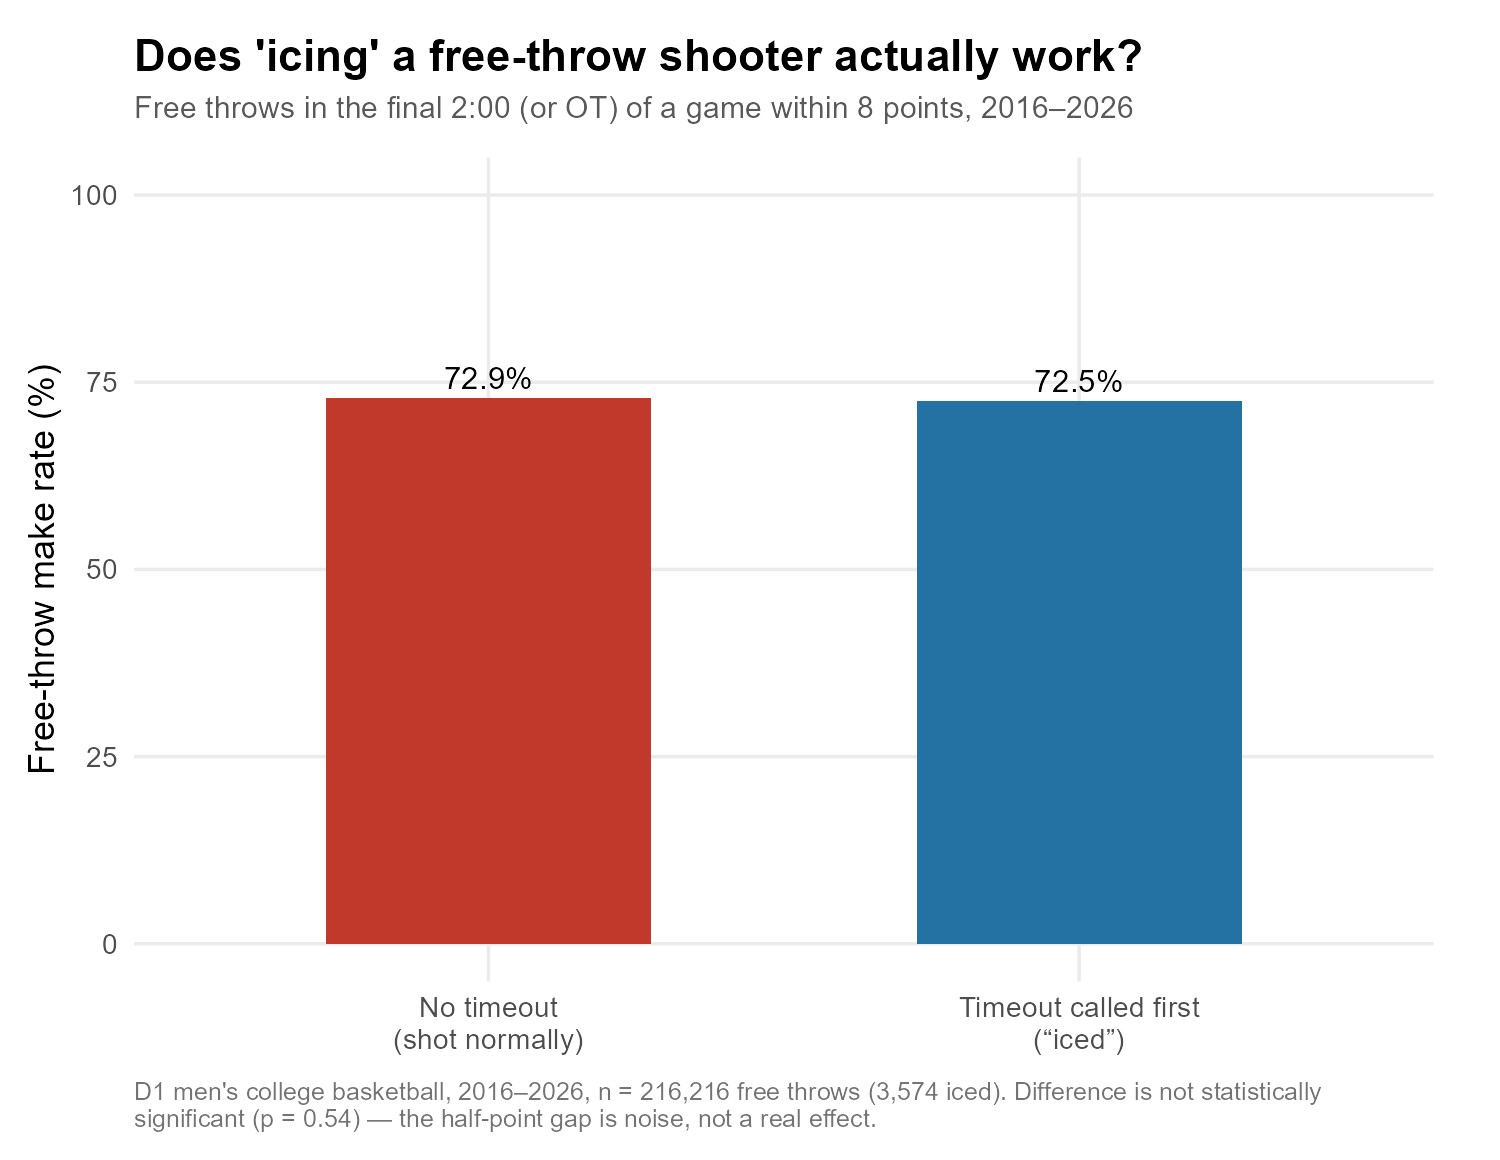
Using every free throw attempted in the final two minutes (or overtime) of a game within 8 points: 216,216 of them across 11 seasons: I checked whether a shooter's make rate changed when the defense called a timeout immediately beforehand. (I had to account for substitutions, which are routinely logged between a timeout and the next shot and would otherwise mask a real "ice", the check looks past those to the last meaningful prior event.)
The answer: no. Shooters iced by a timeout made 72.5% of their free throws (n = 3,574); shooters who went straight to the line made 72.9%. The half-point gap is not statistically significant (p = 0.54). College basketball joins the pile of sports, see also: icing the kicker in football, where "icing" the opponent looks like it should be a psychological weapon and, measured carefully, just isn't one.
Practical takeaways
- For coaches: the conventional wisdom holds, with real nuance, hold something back if you can, but the marginal value of a timeout concentrates in specific windows (trailing or leading by roughly a possession-and-a-half to two possessions), not evenly across every game state. Hoarding for its own sake buys little once a lead is safely 5+ points, or a deficit is down to 1–2.
- For anyone watching a live win-probability model: a team burning its last timeout with 3+ minutes left in a game that's still in doubt is quietly giving up several real points of win probability by the under-1:00 mark.
- For broadcasters: retire "icing" the free-throw shooter as a strategic explanation. It isn't one.
Limitations
- Ten of eleven seasons in this dataset end at their conference tournaments, not the NCAA Tournament itself, this is a regular-season/conference-tournament finding first and foremost.
- These are scoreline-and-time-controlled comparisons, not a randomized experiment. Some residual confounding (team quality, game flow) is possible even after conditioning on score and clock.
- Several subgroup comparisons, especially the by-deficit and by-lead breakdowns, rest on a few hundred observations per cell. Sample sizes are reported throughout rather than glossed over, and the noisier cells are flagged as such in the text.
Methodology, code, and full data tables available on request. Built on the same play-by-play pipeline behind my college basketball ratings and analytics platform.
Explore the LangIndex app →